Geological Hazards
Earthquakes
Meteorological Hazards
Biological and Technological Hazards
Home

Contact the
webmaster.

|
Activity #1
Visit Earthquakes Canada - West. Click on Recent Earthquake Activity. Click on the Map nearest to your location. Choose an earthquake, and then click on the "List of events shown on this plot" (at the bottom of the page). Determine the date, time, depth, magnitude, and region for the earthquake.
Activity #2 The Loma Prieta Earthquake
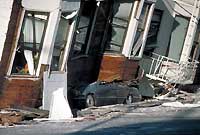
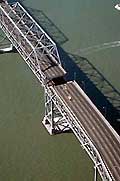
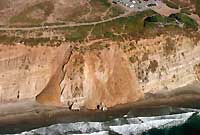
"The images above are photos showing damage caused by the Loma Prieta earthquake to both buildings in San Francisco and the Oakland-Bay Bridge. The 1989 Loma Prieta earthquake was centred in the Santa Cruz Mountains about 16 kilometers northeast of Santa Cruz, CA. This major earthquake caused 63 deaths, 3,757 injuries, and an estimated $6 billion in property damage. It was the largest earthquake to occur on the San Andreas Fault since the great San Francisco earthquake of April 1906. The most severe property damage occurred in Oakland and San Francisco, about 100 kilometres north of the fault segment that slipped on the San Andreas. A modified Mercalli intensity IX was assigned to San Francisco's Marina District, where several houses collapsed, and to four areas in Oakland and San Francisco, where reinforced concrete viaducts collapsed: Nimitz Freeway (Interstate 880) in Oakland, and Embarcadero Freeway, Highway 101, and Interstate 280 in San Francisco. Communities sustaining heavy damage in the epicentral area included Los Gates, Santa Cruz, and Watsonville."
(The above description of the earthquake is from the U.S. Geological Survey web site. For more information visit this web site.)
The figure above is a isoseismal map showing modified Mercalli intensities associated with the Loma Prieta earthquake. An isoseismal map shows contours or lines (red and orange in the figure) that separate regions of equal Mercalli intensities. The intensities shown on the map range from VI to IX. Review the Modified
Mercalli Scale and determine the range of damage to buildings for the
different regions. Locate the epicenter. What is the modified Mercalli intensity at the
epicenter? What is the modified Mercalli intensity for the San Francisco Bay area? If San Francisco is 100 kilometres from the epicenter, why did it register
intensities greater than those at the epicenter. Review section on mitigation.
Study the map above showing susceptibility for liquefaction in the San
Francisco Bay area. The dark blue colour on the map is water. What is the
susceptibility level for liquefaction in San Francisco? Return to question 4 and revise answer, if needed. Explain the following statement: "Damage to structures is not
only related to size of or distance to the earthquake."
|