
Google Earth Exercise: Chapter 4
Visualizing the Three Gorges Dam Hydroelectric Project
The Three Gorges Dam was the largest infrastructure project in China since the Great Wall. Completed in 2006, it reached full operating capacity in 2012. In a growing, rapidly urbanizing nation that relies primarily on fossil fuels for its energy demands, a hydroelectric project of this scale offers a significantly cleaner alternative. In addition to the social and environmental issues mentioned in the textbook, the rise in water levels has also brought with it decreased slope stability. The relocation program for the more than one million citizens living in the footprint of the reservoir may now be extended to a further 100,000 due to geological hazards like landslides.
The task: Using Google Earth, visit the Three Gorges Dam, examine the topography of the valley and create a water level layer to depict the growing reservoir. Make measurements of the affected area.
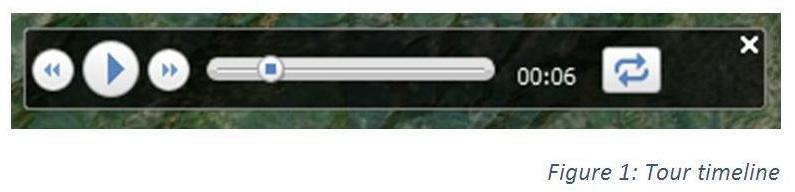
Step 1: Ensure you have the 3D buildings option checked in the “Layers” menu (bottom right of interface). Download chapter4.kmz file from the student resources site. Double click on the “Three Gorges Dam (Approach)” tour. This will provide you with a flyover view of the valley and end at the dam itself. Observe the eye altitude in the bottom right of the screen. As the camera descends to the ground the imagery changes.
You can manipulate the timeline to view the valley in its pre-construction state, with original stream width. As you zoom in, more recent imagery depicts the reservoir in its filled state.

Step 2: Use the ruler tool (Figure 2) to determine the width of the river at points A and B in both pre-damming and filled reservoir states.
Question 1: After the reservoir was filled, how much wider did the channel become at both points?
Question 2: How wide is the dam itself?
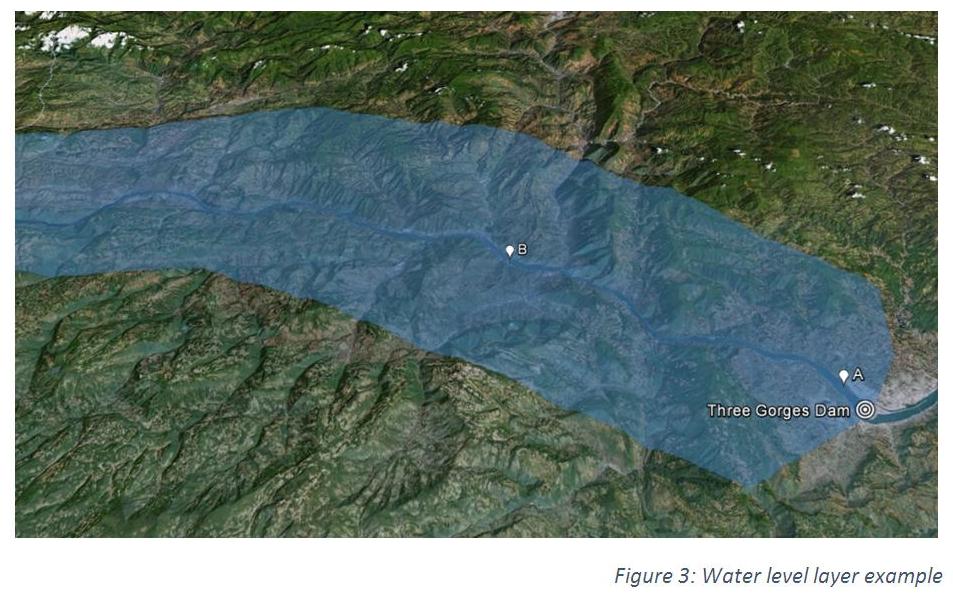
Step 3: We can visualize the rising water in the reservoir by creating a polygon layer (Figure 3) that covers the area of the valley. Create the polygon, then right click the shape in the “places” sidebar and select “properties.” Navigate to the “altitude” tab. Switch from “clamped to ground” to “absolute.”
Question 3: Setting altitude in “absolute” mode determines the polygons’ vertical positioning relative to what baseline?
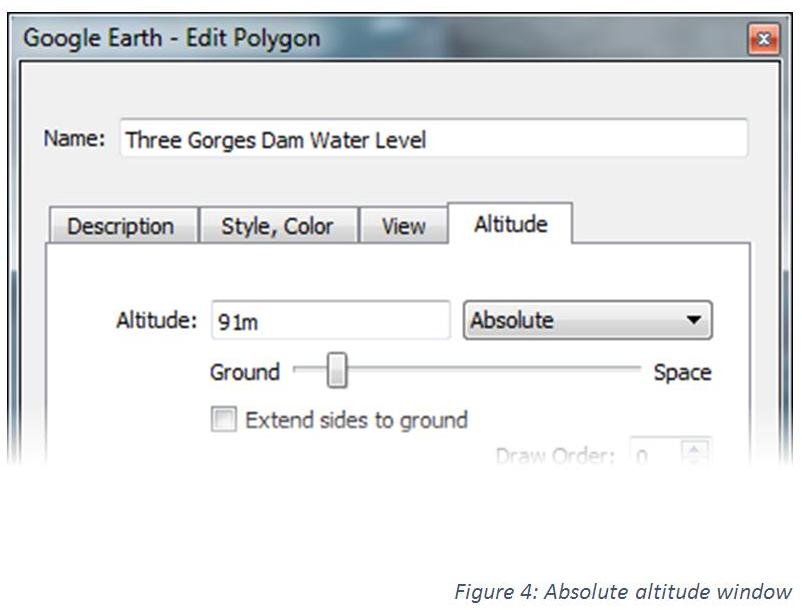
Set the absolute altitude to 91m (Figure 4), which most closely resembles pre-construction levels. Then move the slider up until the reservoir is flooded.
Question 4: At what absolute height does your polygon match the water level from the satellite images? What is the actual water level in the reservoir at present time?
When you have answered the four questions above, scroll to the bottom of the page to check your answers.
Answers:
Question 1: The channel widens from ~900m to 2800m at point A and from about ~660m to 1200m at point B.
Question 2: The dammed part of the river is ~1700m wide, while the structure itself is about 2800m.
Question 3: Absolute altitude is relative to sea level.
Question 4: The polygon will match the extent of the reservoir at ~175m above sea level. This is 10m below the height of the dam and represents the design capacity of the reservoir and the maximum water level.